GamesChart · sourced and dated
Every game, scored by 107M ratings.
Critics and players from 5 review sources, combined into one score for 3,236 games. Plus the drop rates and real costs behind the games you play.
GamesChart Score · ratings pulled 5 Nov 2026
The best games of all time
Averaged over multiple review sites, critics and players weighted equally.
 Rank 1Score 91.3
God of War
Santa Monica Studio · 2018
 Rank 2Score 91.2
Portal 2
Valve · 2011
 Rank 3Score 91.0
Baldur's Gate III
Larian Studios · 2023
 Rank 4Score 90.8
The Witcher 3: Wild Hunt
CD Projekt RED · 2015
 Rank 5Score 90.8
Red Dead Redemption 2
Rockstar Games · 2018
 Rank 6Score 90.4
Hades
Supergiant Games · 2020
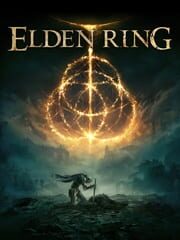 Rank 7Score 90.3
Elden Ring
FromSoftware · 2022
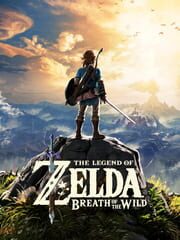 Rank 8Score 90.2
The Legend of Zelda: Breath of the Wild
Nintendo EPD Production Group No. 3 · 2017
 Rank 9Score 90.2
Super Mario Odyssey
Nintendo EPD Production Group No. 8 · 2017
 Rank 10Score 89.5
Undertale
tobyfox · 2015
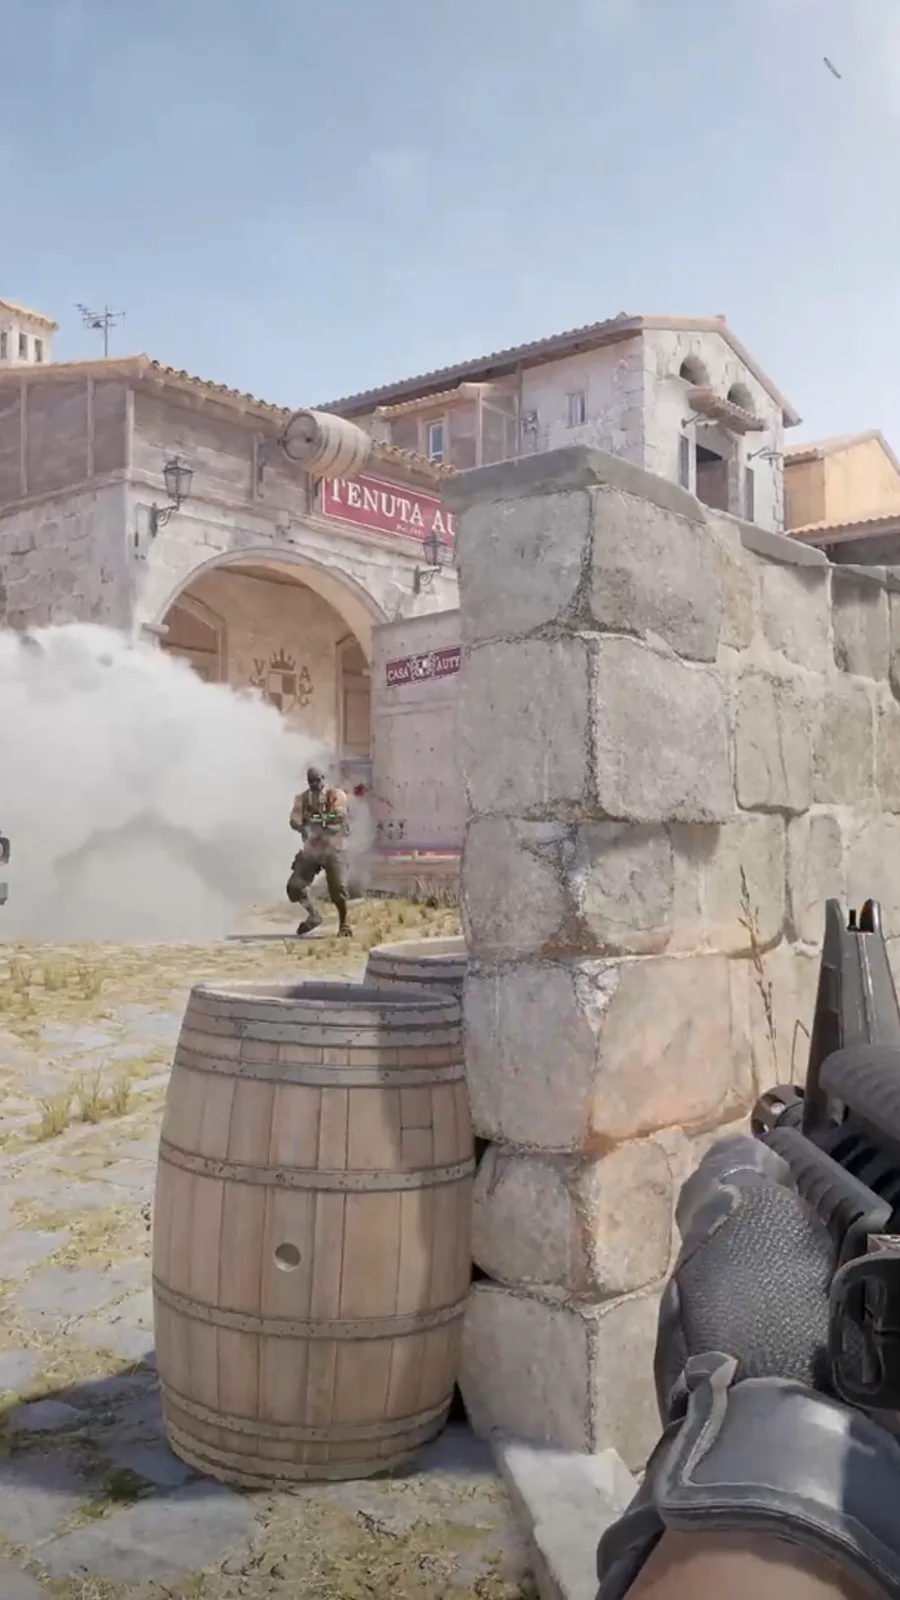
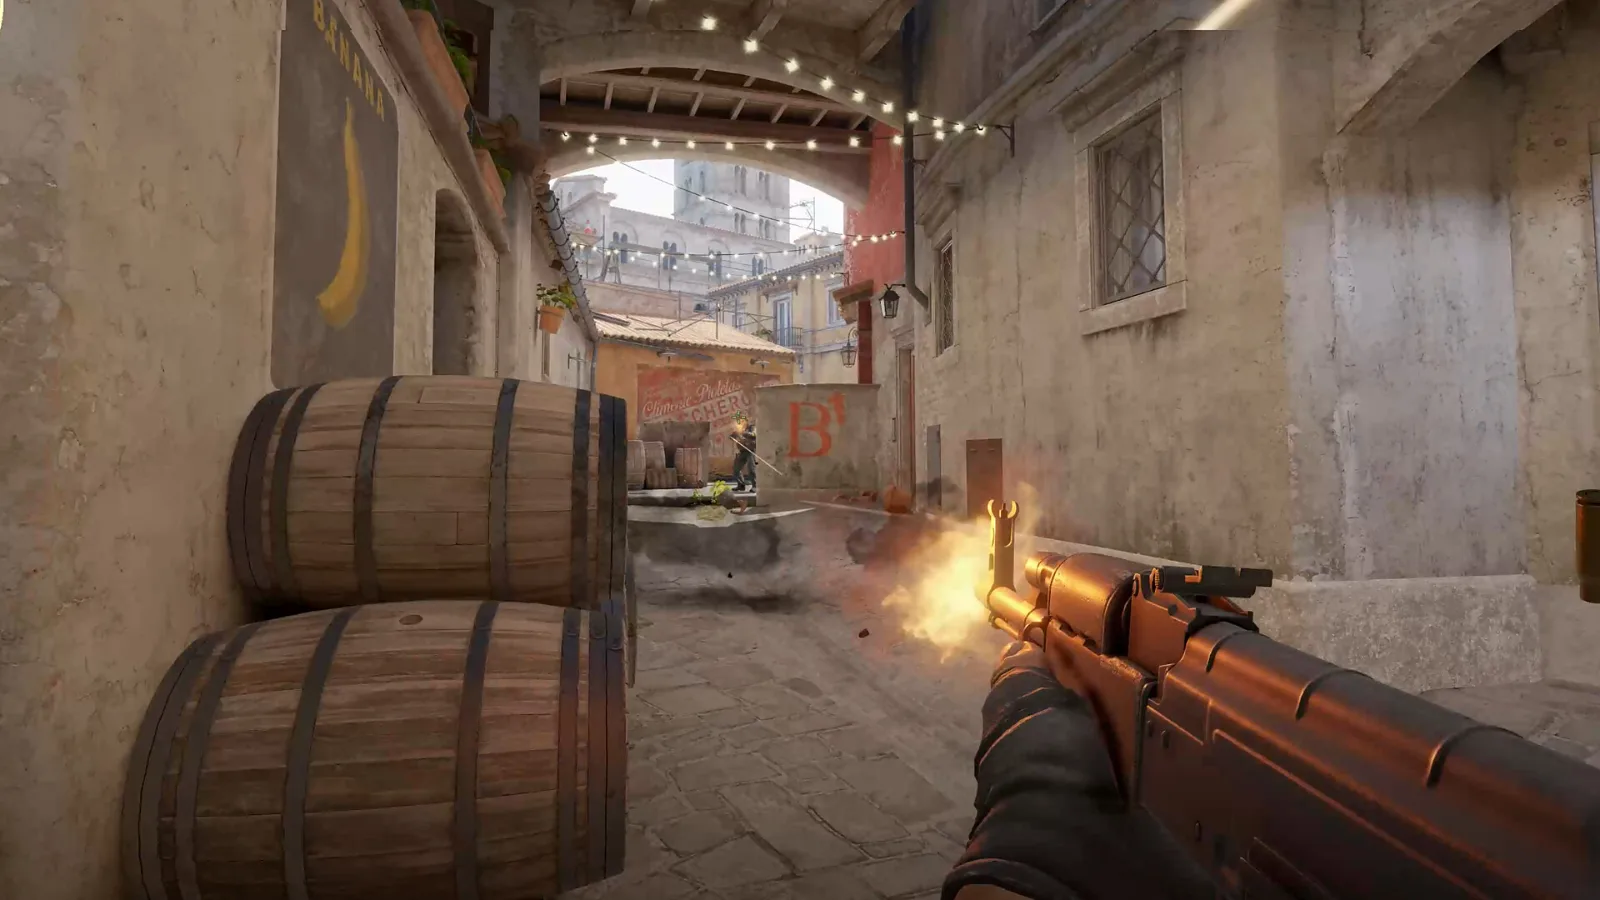
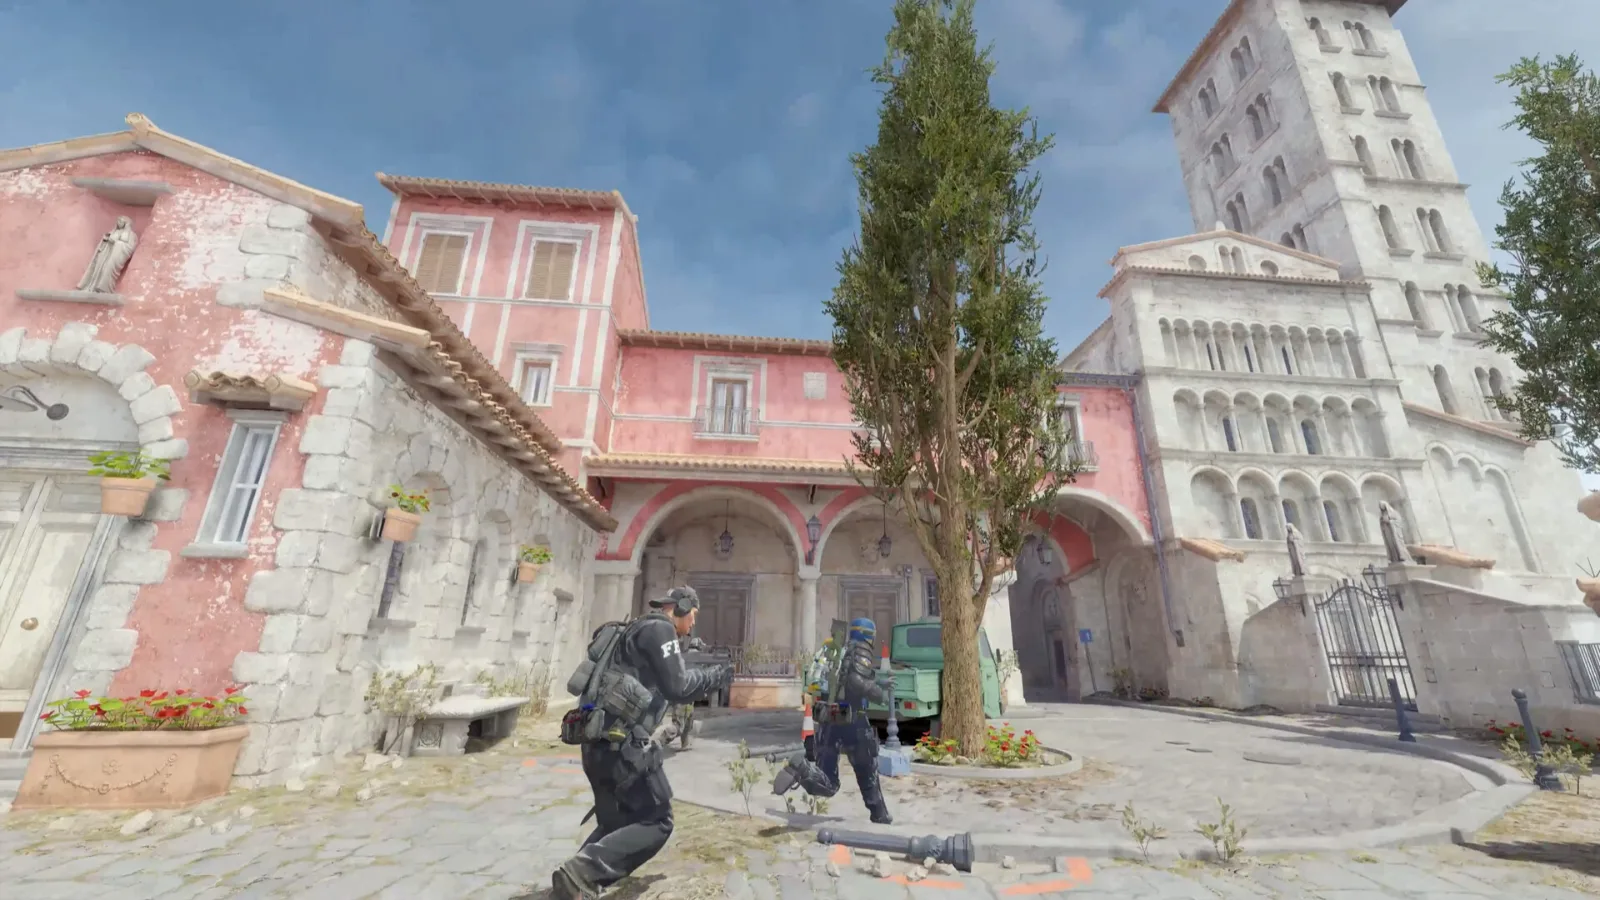
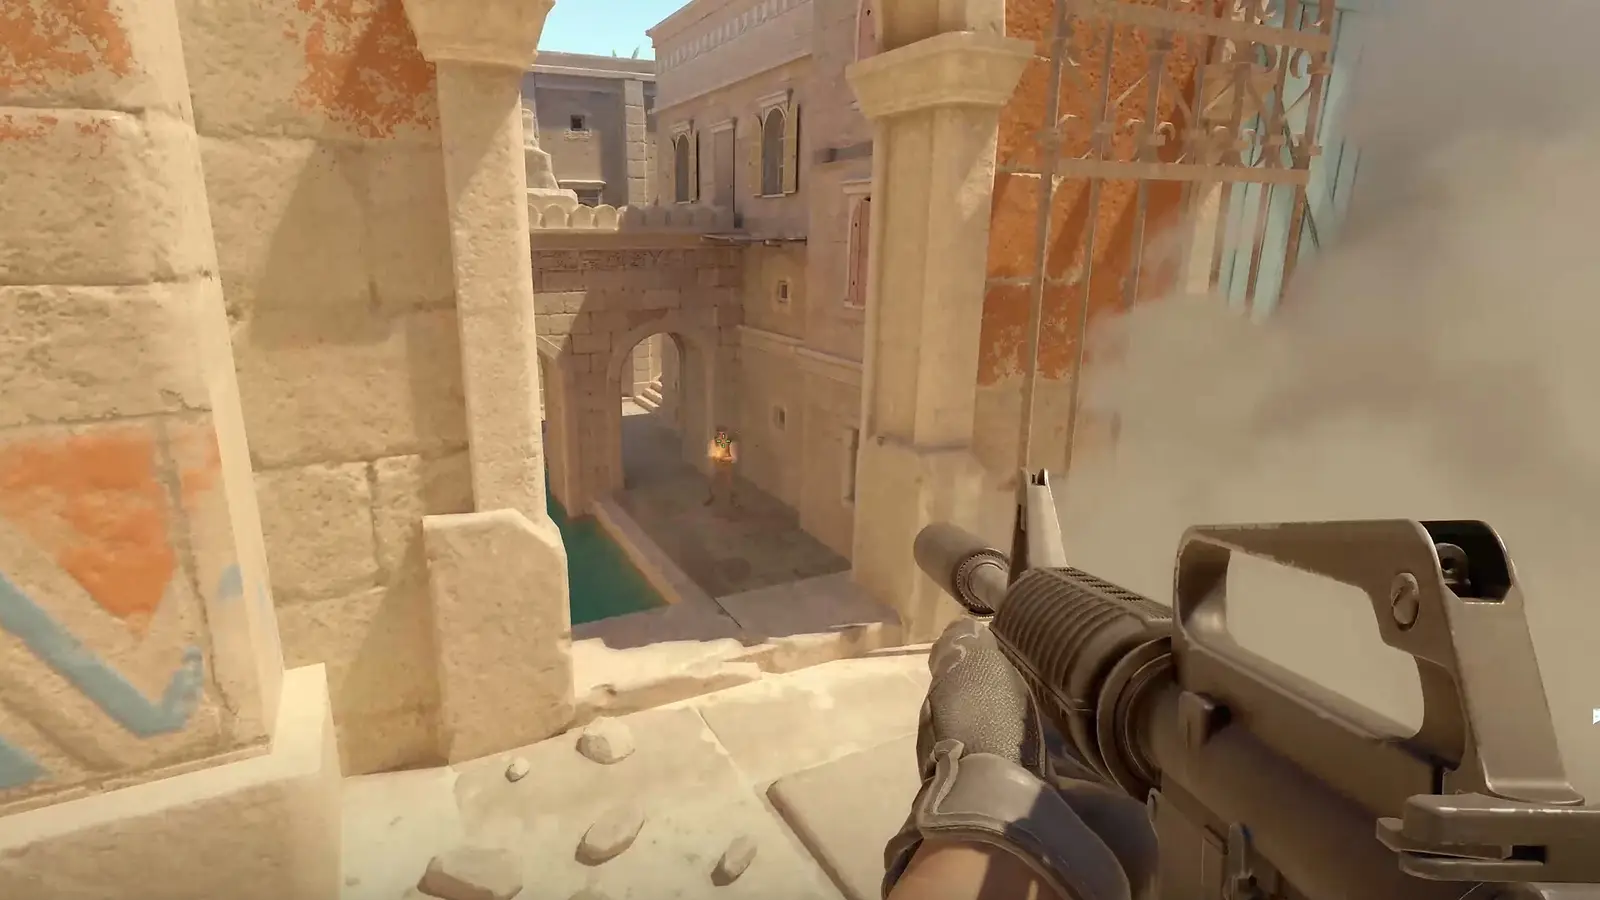
Most played this week: Counter-Strike 2, Dota 2, Phantom Blade Zero · Weekly chart →
Choose your game

- Dota 2
- Baldur's Gate 3
- Apex Legends
- Diablo IV
- Fortnite
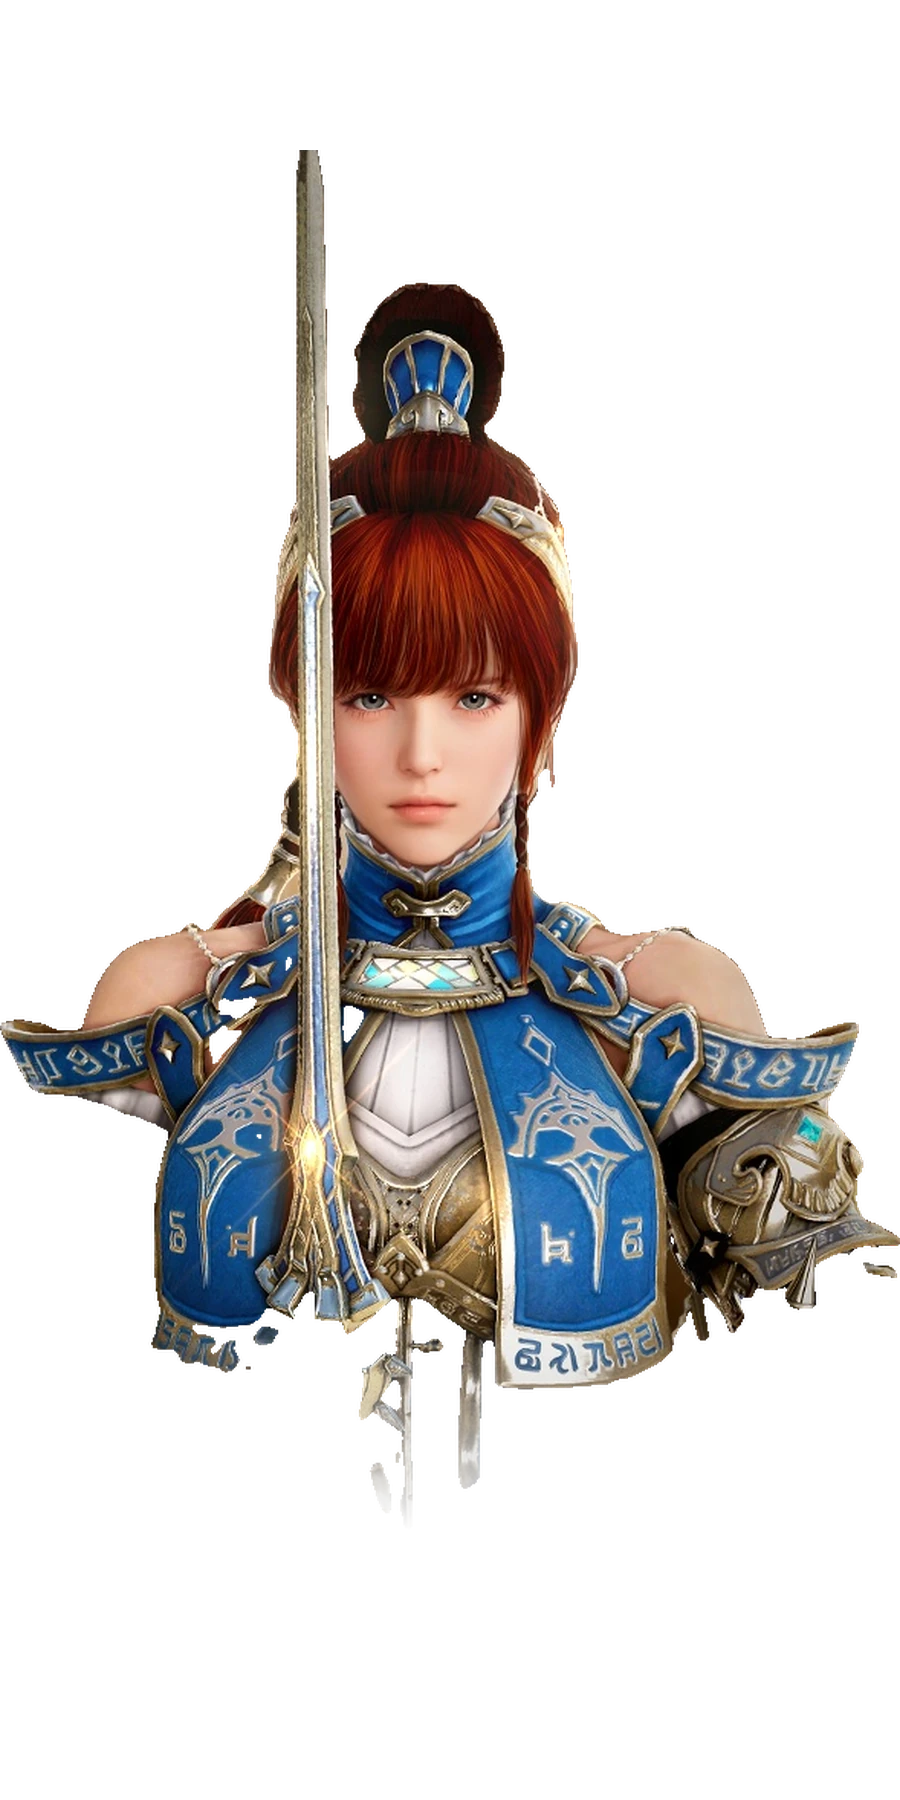
- Phantom Blade Zero
- Wuthering Waves
- Black Myth: Wukong
- Naraka: Bladepoint
- '83
- Batman: Arkham City
- Bloodborne
- Fable
- God of War Laufey
- Grand Theft Auto VI
- Grand Theft Auto: San Andreas
- Lords of the Fallen II
- Metroid Prime
- Persona 5
- Resident Evil 2
- Shadow of the Colossus
- Super Mario Galaxy
- Super Mario Galaxy 2
- Super Mario Odyssey
- The Legend of Zelda: Breath of the Wild
- The Legend of Zelda: Majora's Mask
- The Legend of Zelda: Ocarina of Time
- The Legend of Zelda: Tears of the Kingdom
- Uncharted 2: Among Thieves
- Uncharted 3: Drake's Deception
- Uncharted 4: A Thief's End
- Warhammer 40,000: Dawn of War IV
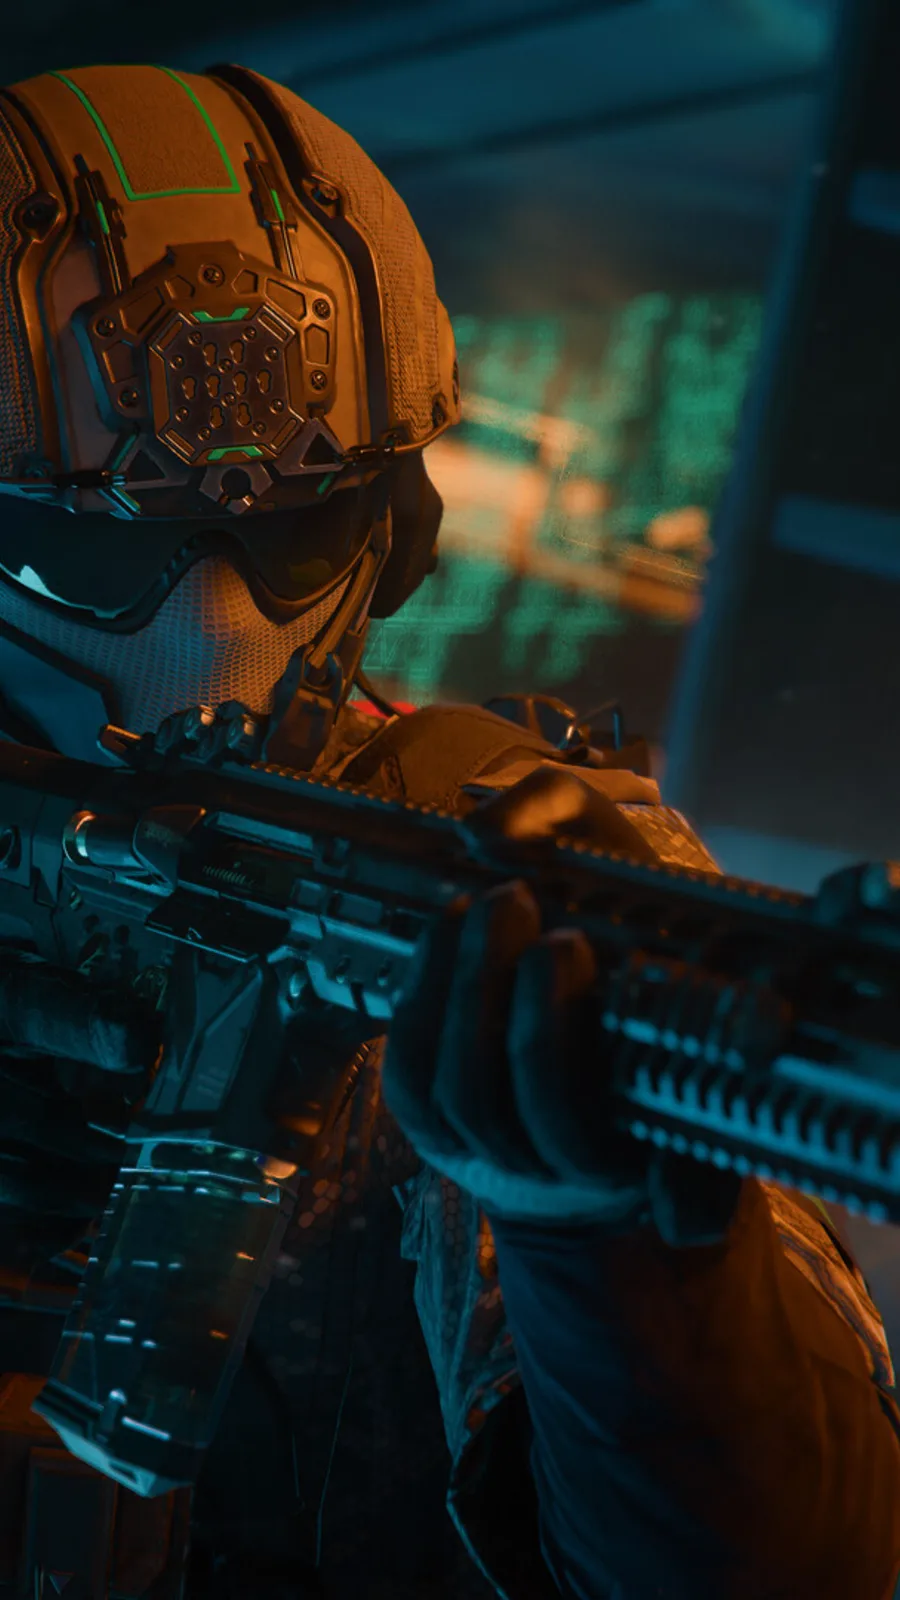
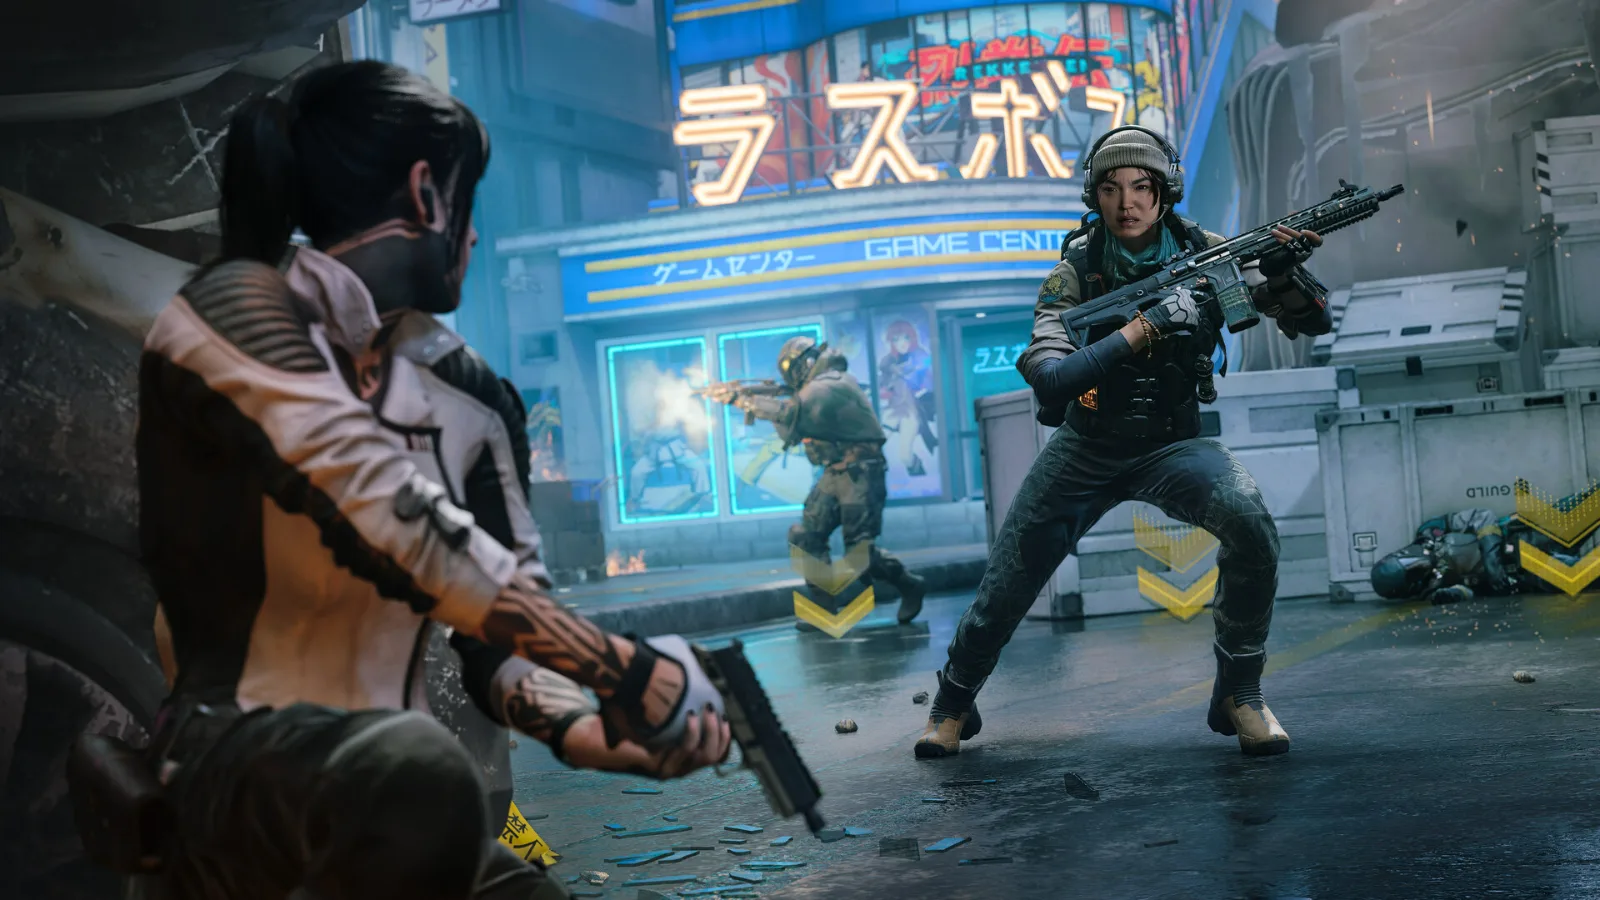
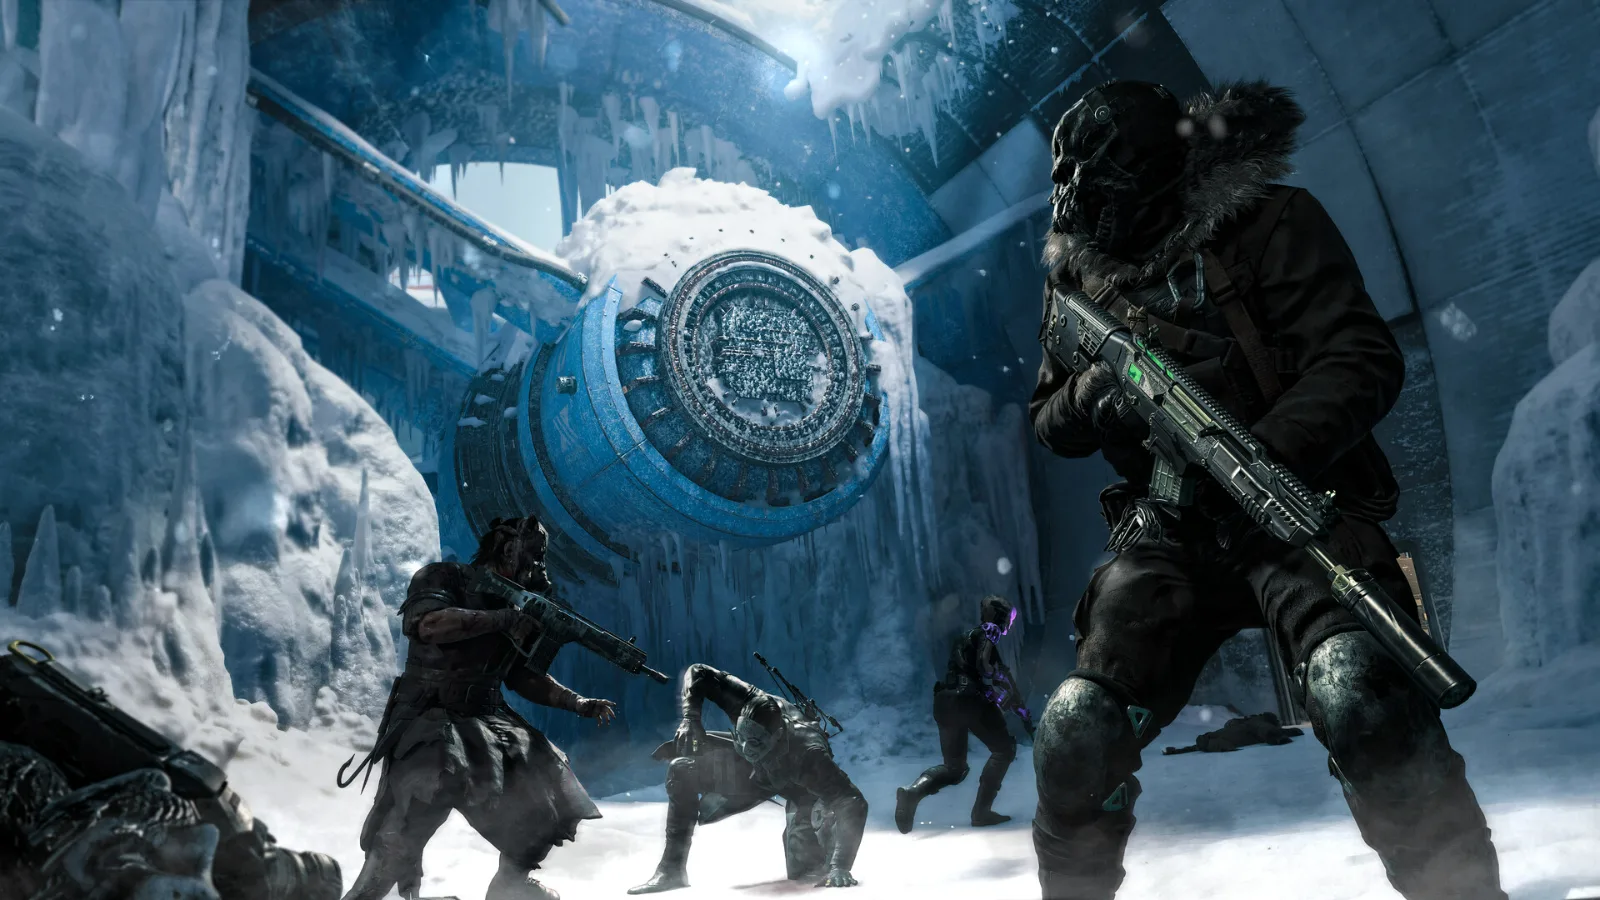
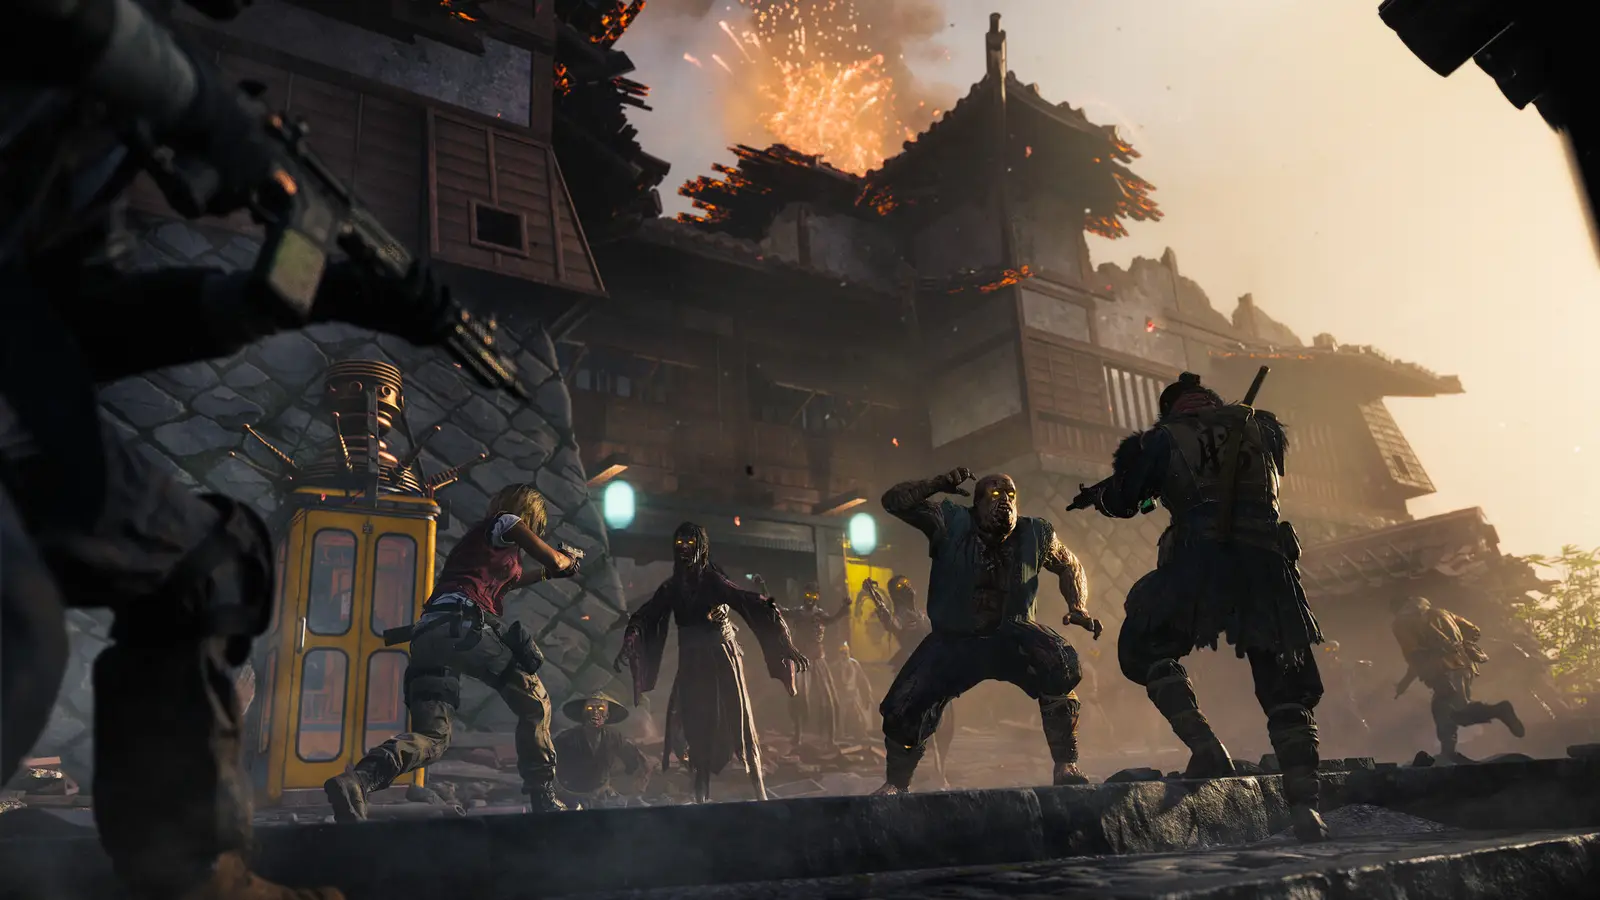
- Call of Duty: Modern Warfare 4
- Valheim
- ARC Raiders
- The Witcher 3: Wild Hunt
- Enshrouded
- Age of Empires II: Definitive Edition
- War Thunder
- Stardew Valley
- Lost Ark
- Tom Clancy's Rainbow Six Siege
- Grand Theft Auto V
- Battlefield 6
- Destiny 2
- Magic: The Gathering Arena
- Red Dead Redemption 2
- Sid Meier's Civilization VI
- Elden Ring
- Diablo II: Resurrected
- It Takes Two
- Ori and the Will of the Wisps
- Final Fantasy XIV
- SCUM
- Tom Clancy's The Division 2
- Slay the Spire
- Sekiro: Shadows Die Twice
- Hollow Knight
- Dark Souls III
- Divinity: Original Sin II
- The Elder Scrolls Online
- Path of Exile
- Clair Obscur: Expedition 33
- Hades
- Grand Theft Auto IV
- Marvel's Spider-Man
- Resident Evil Requiem
- Dark Souls
- The Last of Us
- The Last of Us Part II
- Starfield
- Marathon
- Team Fortress 2
- God of War
- Throne and Liberty
- God of War Ragnarök
- Portal 2
- Cuphead
- Fellowship
- Undertale
- Metal Gear Solid V: The Phantom Pain
- Titanfall 2
- Celeste
- Half-Life 2
- Disco Elysium
- Predecessor
- The Elder Scrolls V: Skyrim
- NieR: Automata
- Half-Life
- Resident Evil 4
- Red Dead Redemption
- LEGO Star Wars: The Skywalker Saga
- Portal
- Assassin's Creed II
- Supreme Commander: Forged Alliance
- Tekken 7
- MapleStory
- ANEURISM IV
- BattleBit Remastered
- BioShock
- BioShock Infinite
- Blade & Sorcery
- Dead Space 2
- Deus Ex: Human Revolution
- Dragon Age: Origins
- ENDLESS Dungeon
- Fallout 2
- Fallout: A Post Nuclear Role Playing Game
- Grand Theft Auto: Vice City
- Half-Life: Alyx
- Inside
- Journey
- Mass Effect 2
- Metal Gear Solid 3: Snake Eater
- Prince of Persia: The Lost Crown
- Ratchet & Clank: Rift Apart
- Return of the Obra Dinn
- Skull and Bones
- Star Wars: Knights of the Old Republic
- SYNDUALITY Echo of Ada
- System Shock 2
- Tales from the Borderlands
- The Elder Scrolls IV: Oblivion
- What Remains of Edith Finch
- X-COM: UFO Defense
- Old School RuneScape
- EVE Online
- Command & Conquer: Generals – Zero Hour
- Genshin Impact
- Valorant
- World of Warcraft Classic
- LawBreakers
- League of Legends


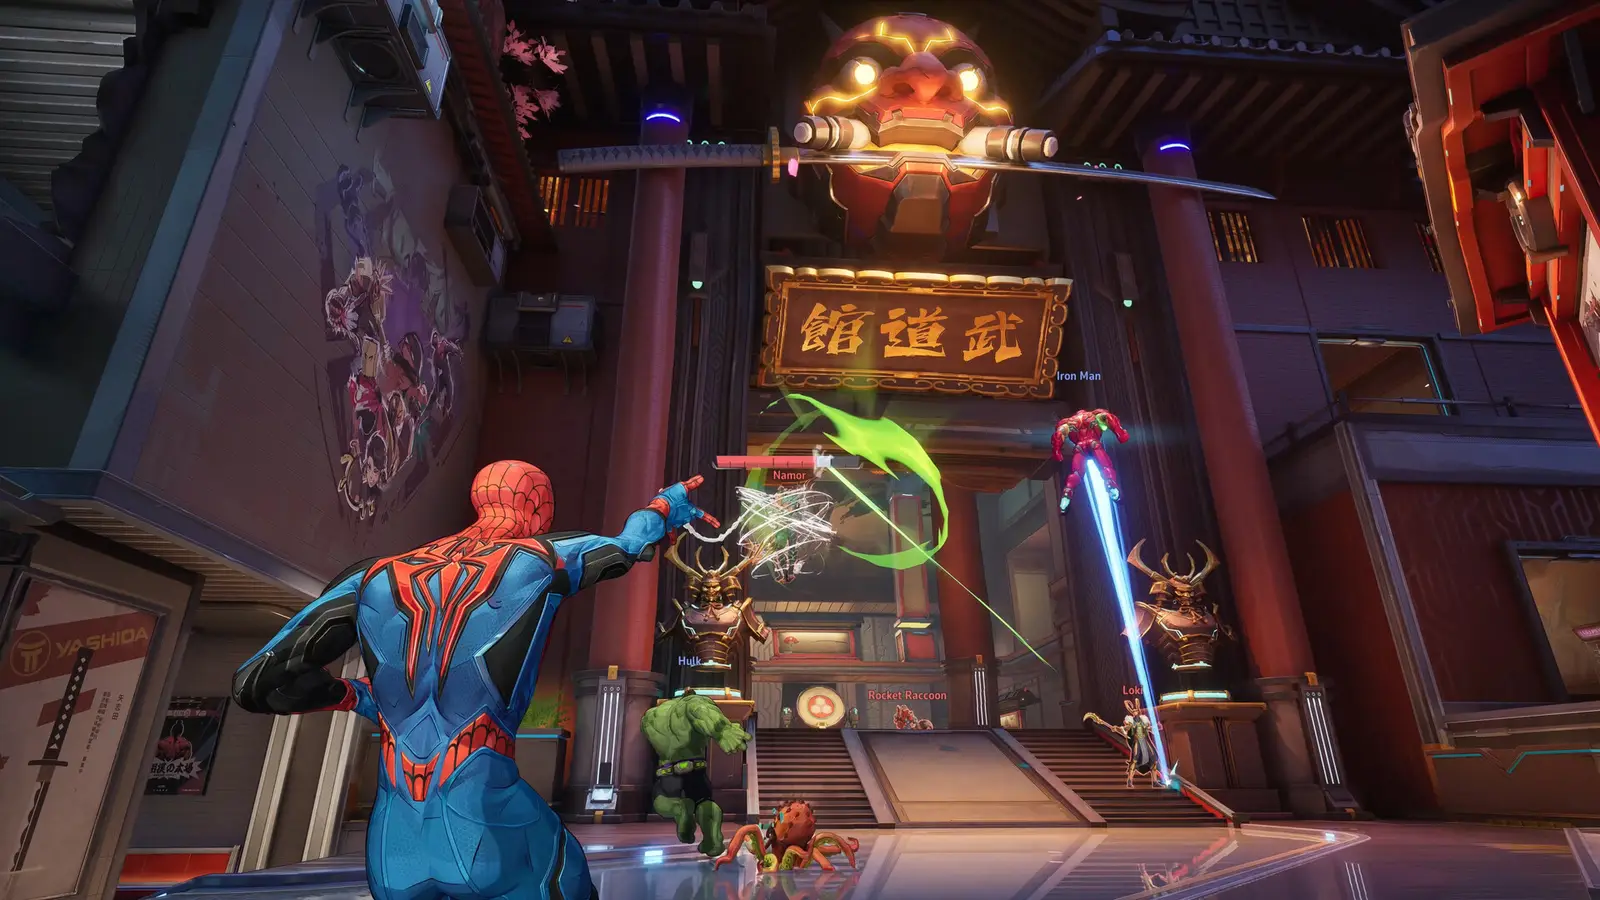
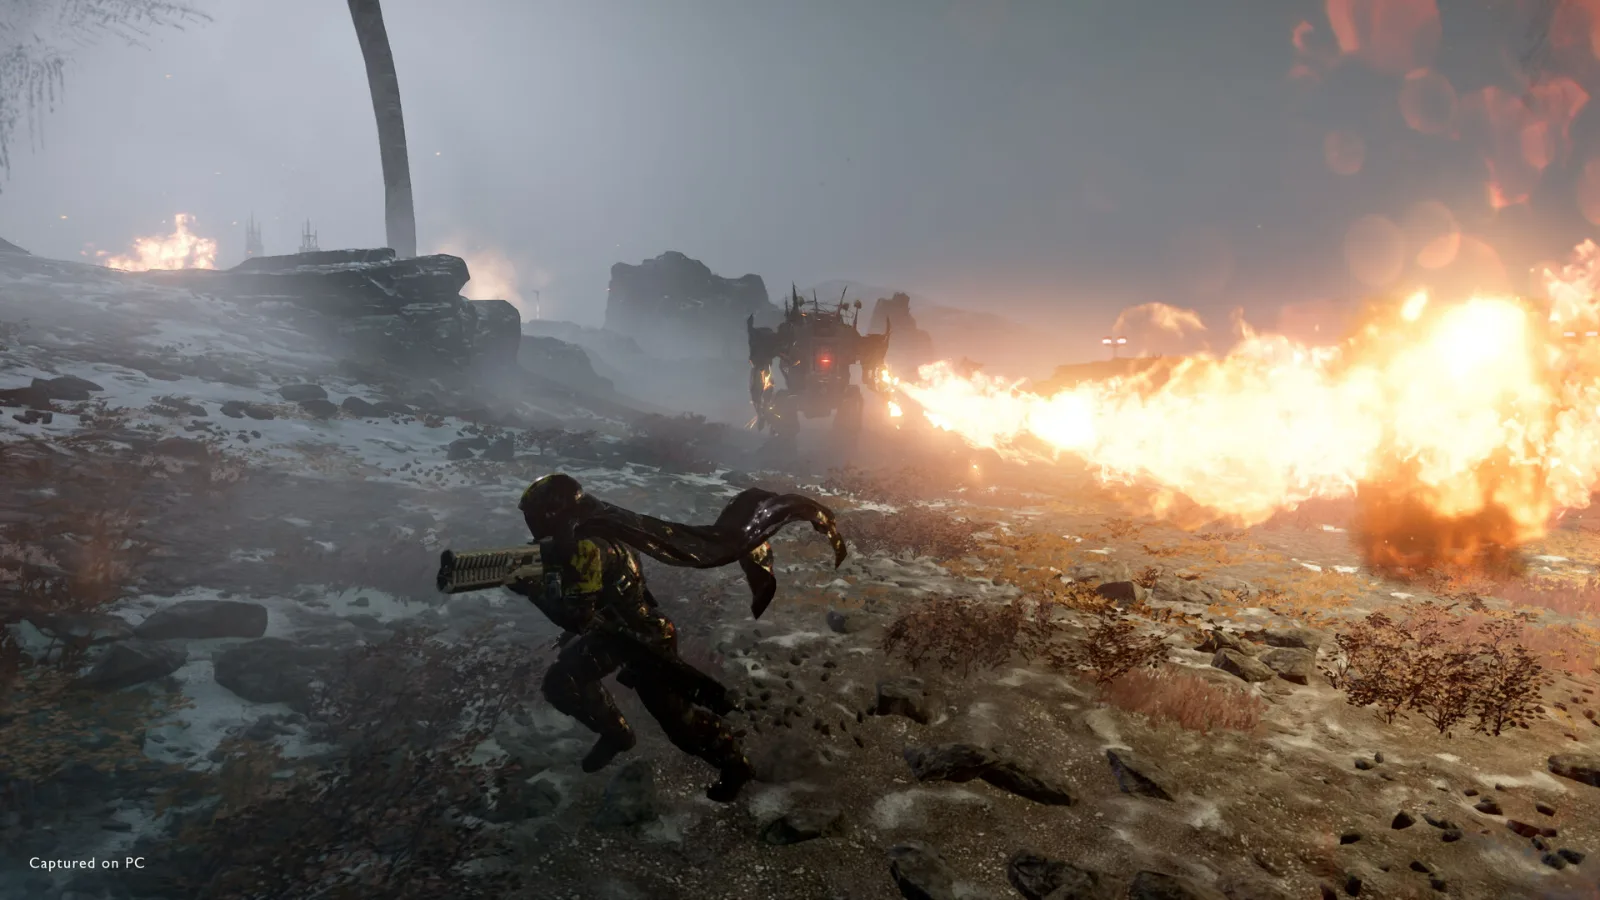
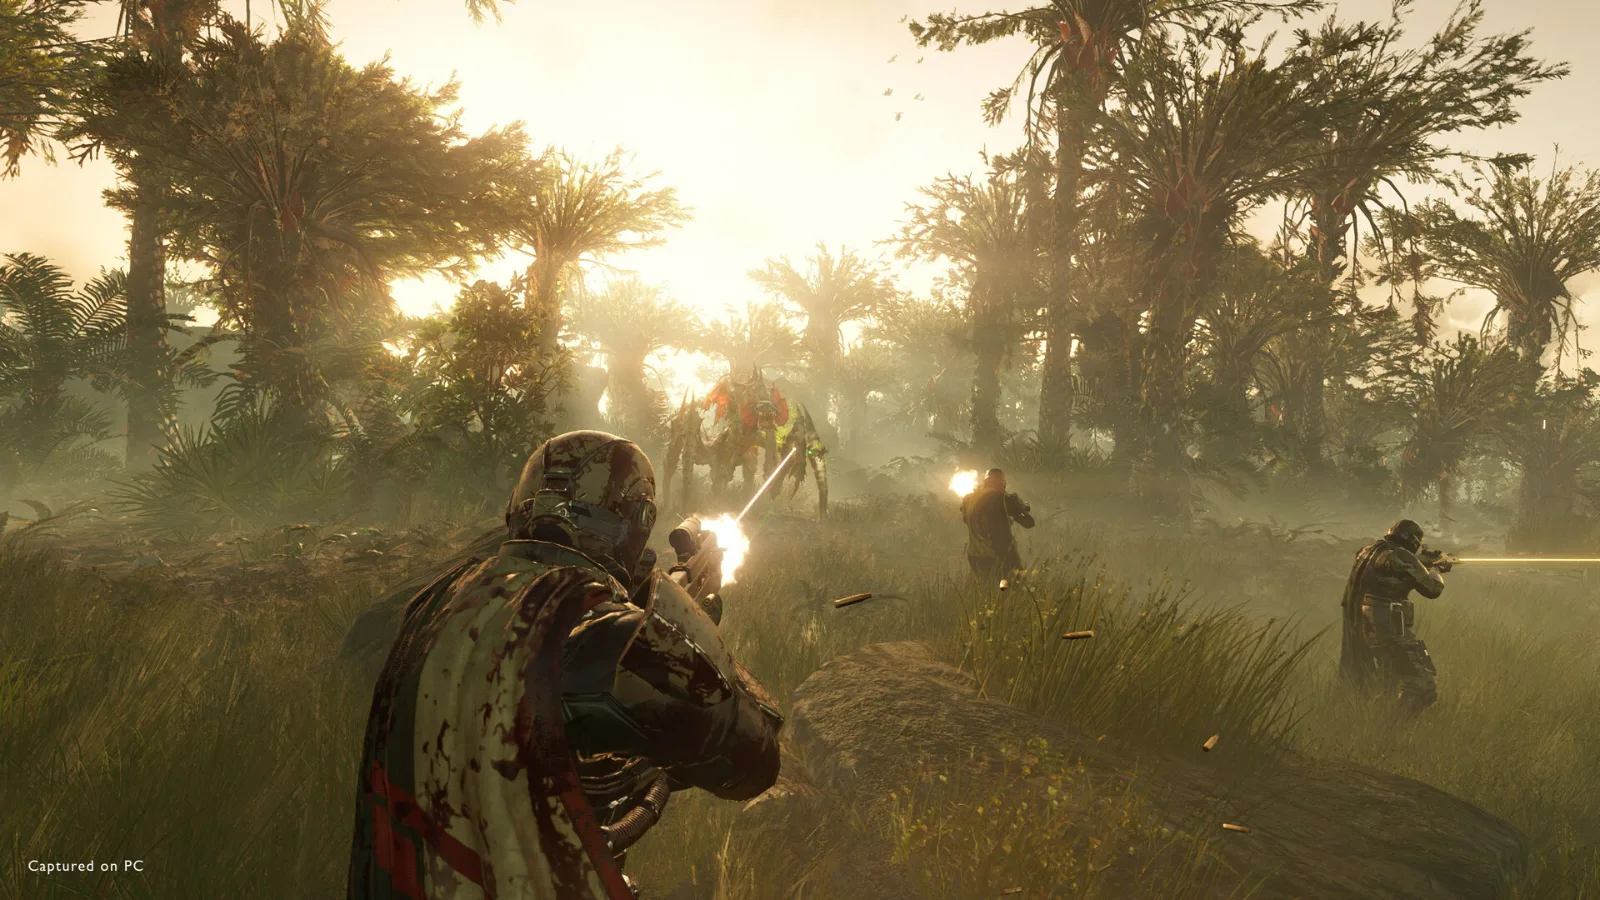
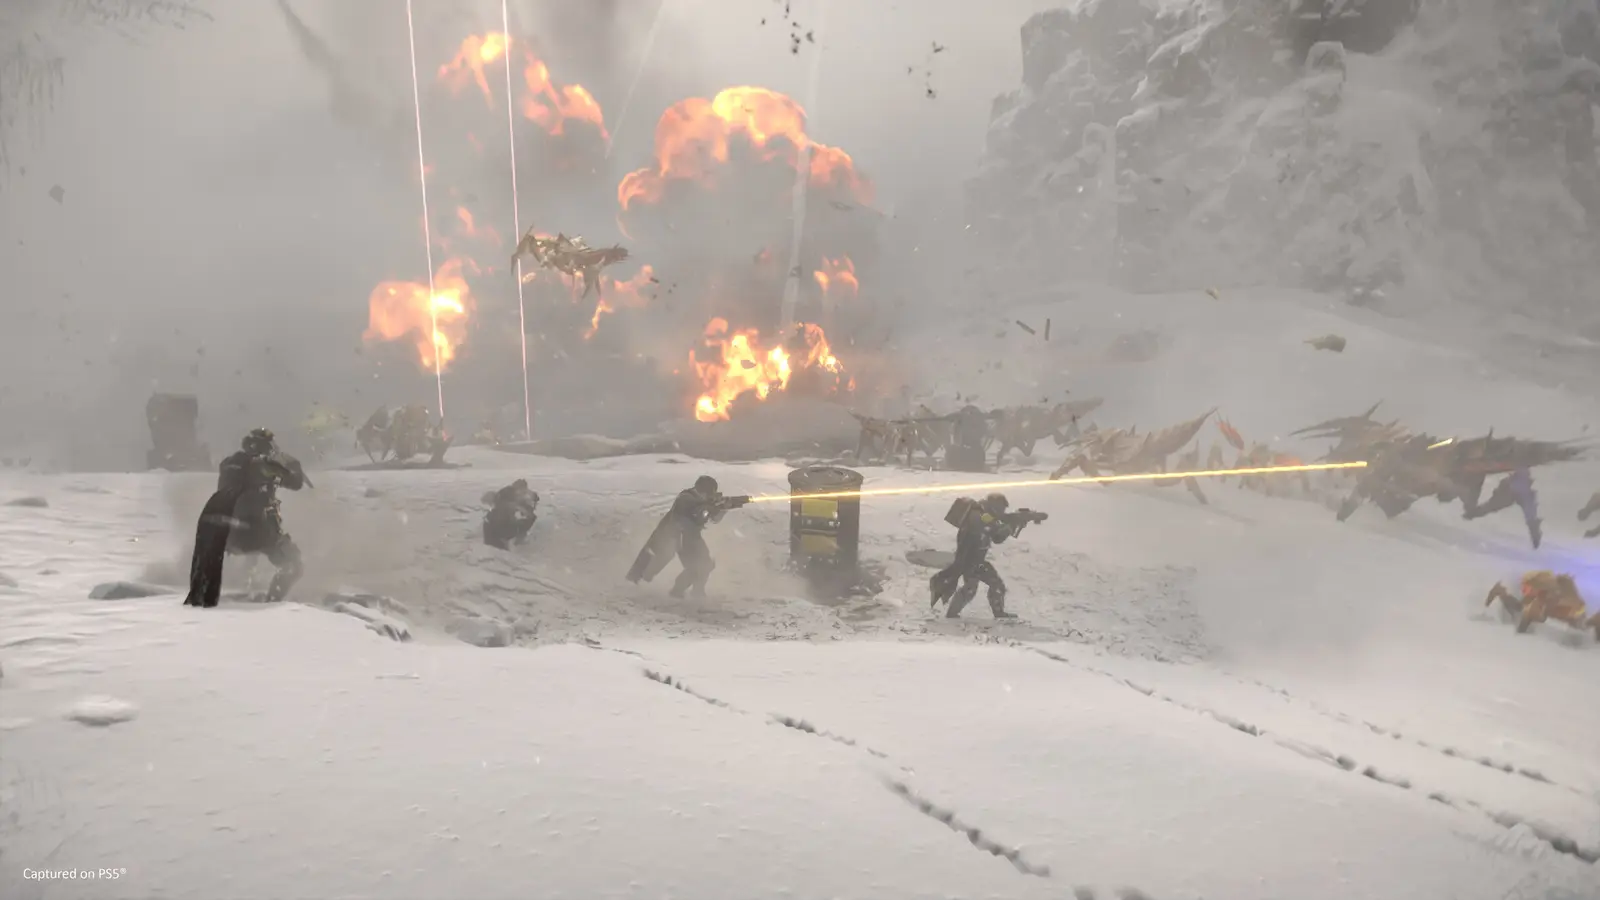
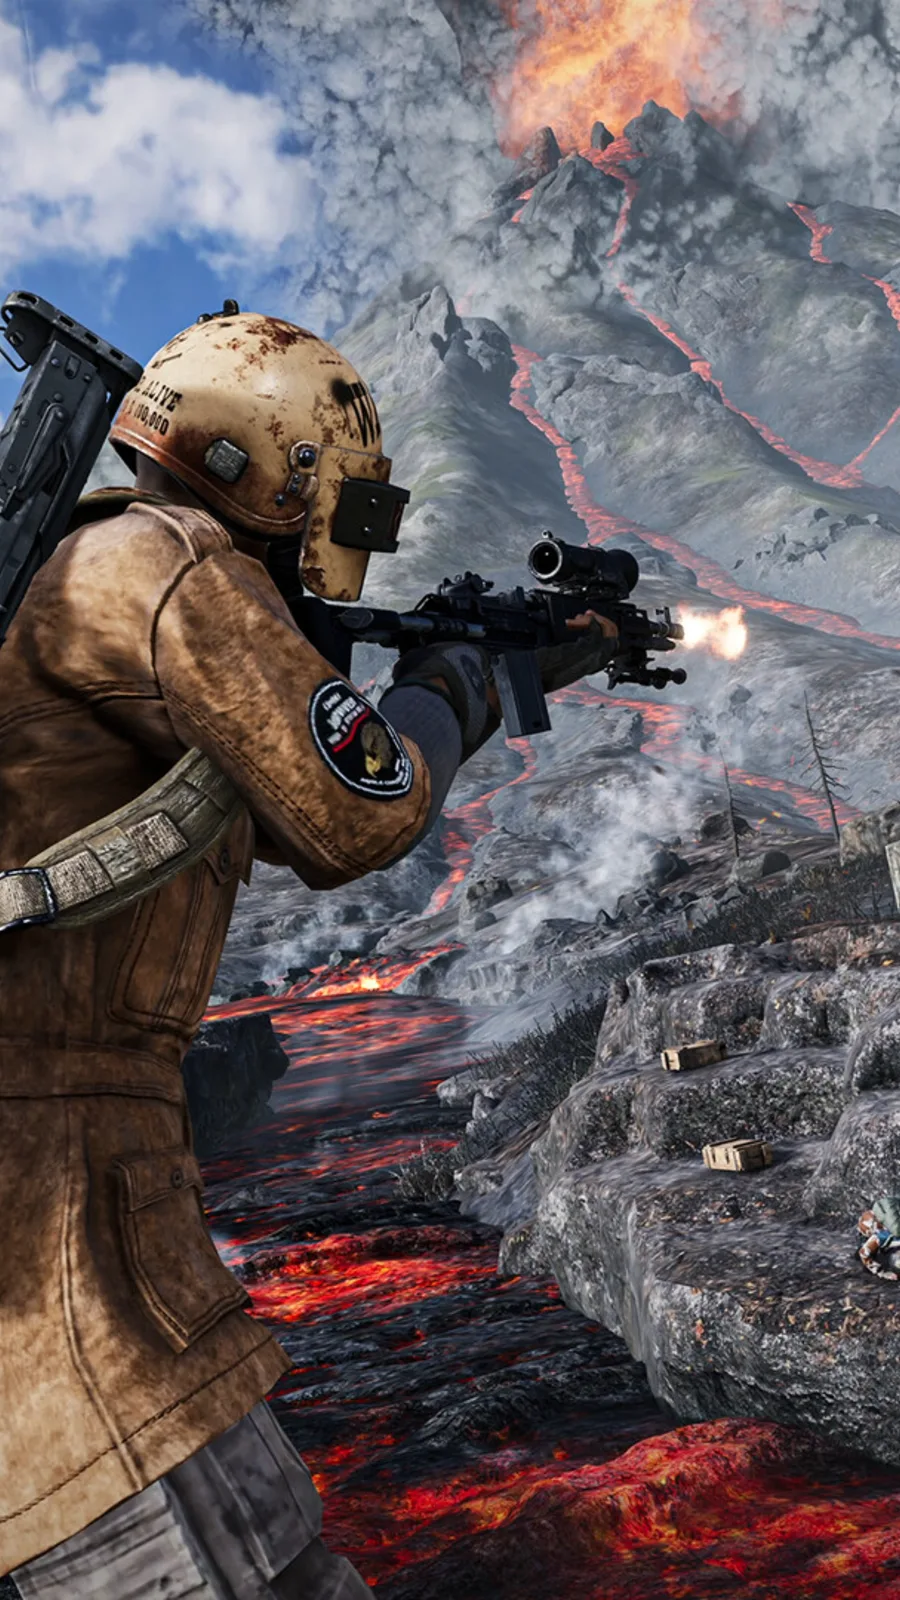
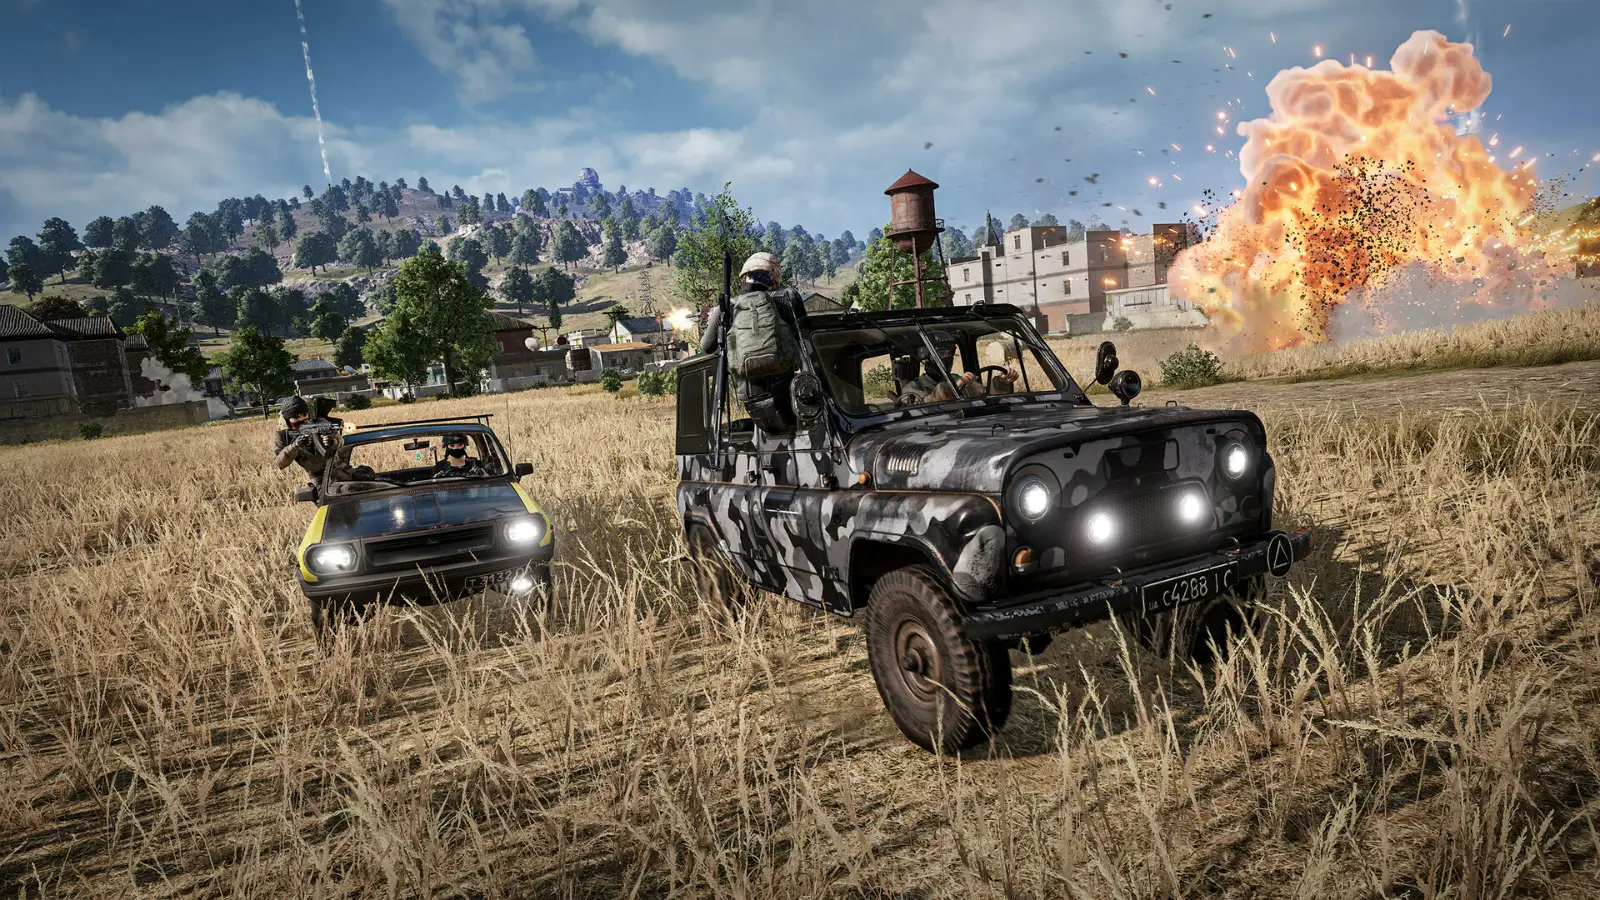
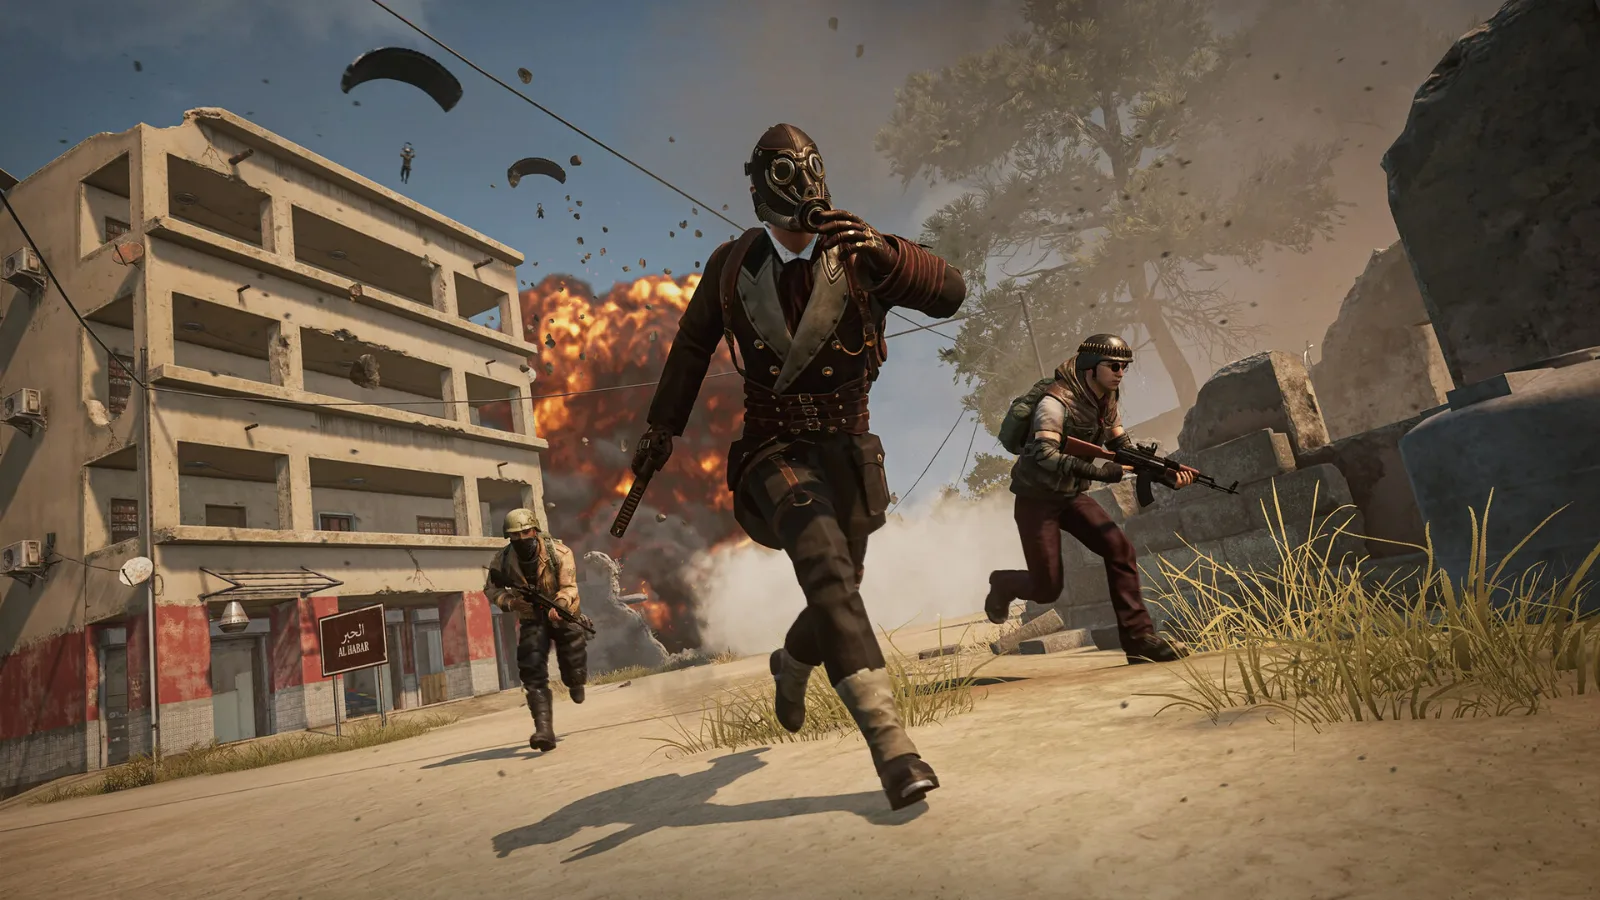
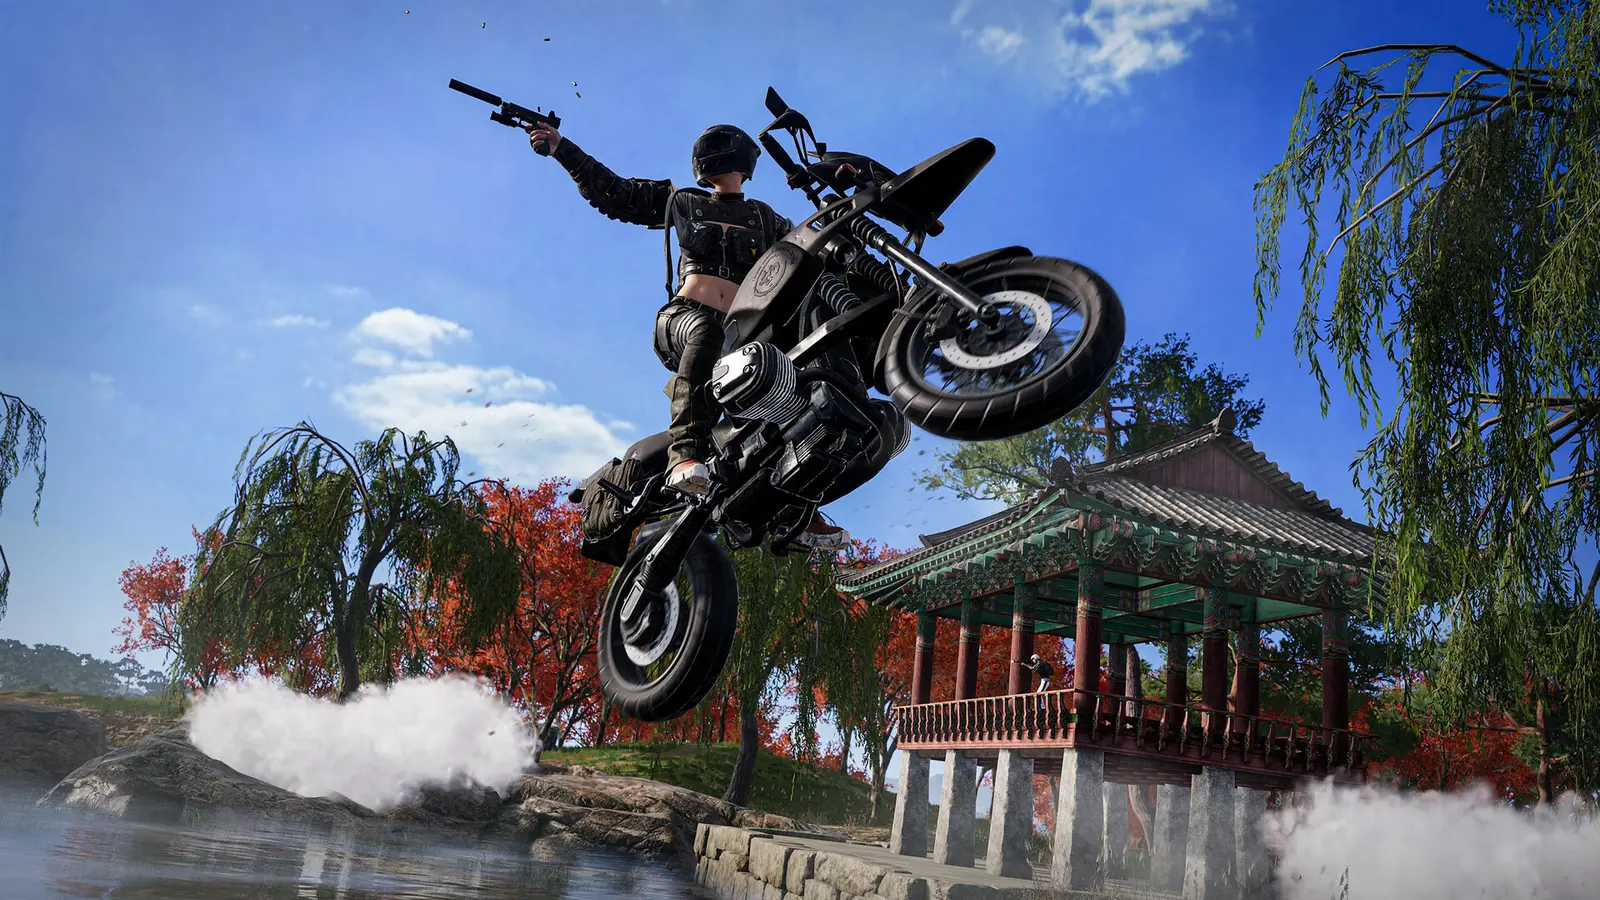
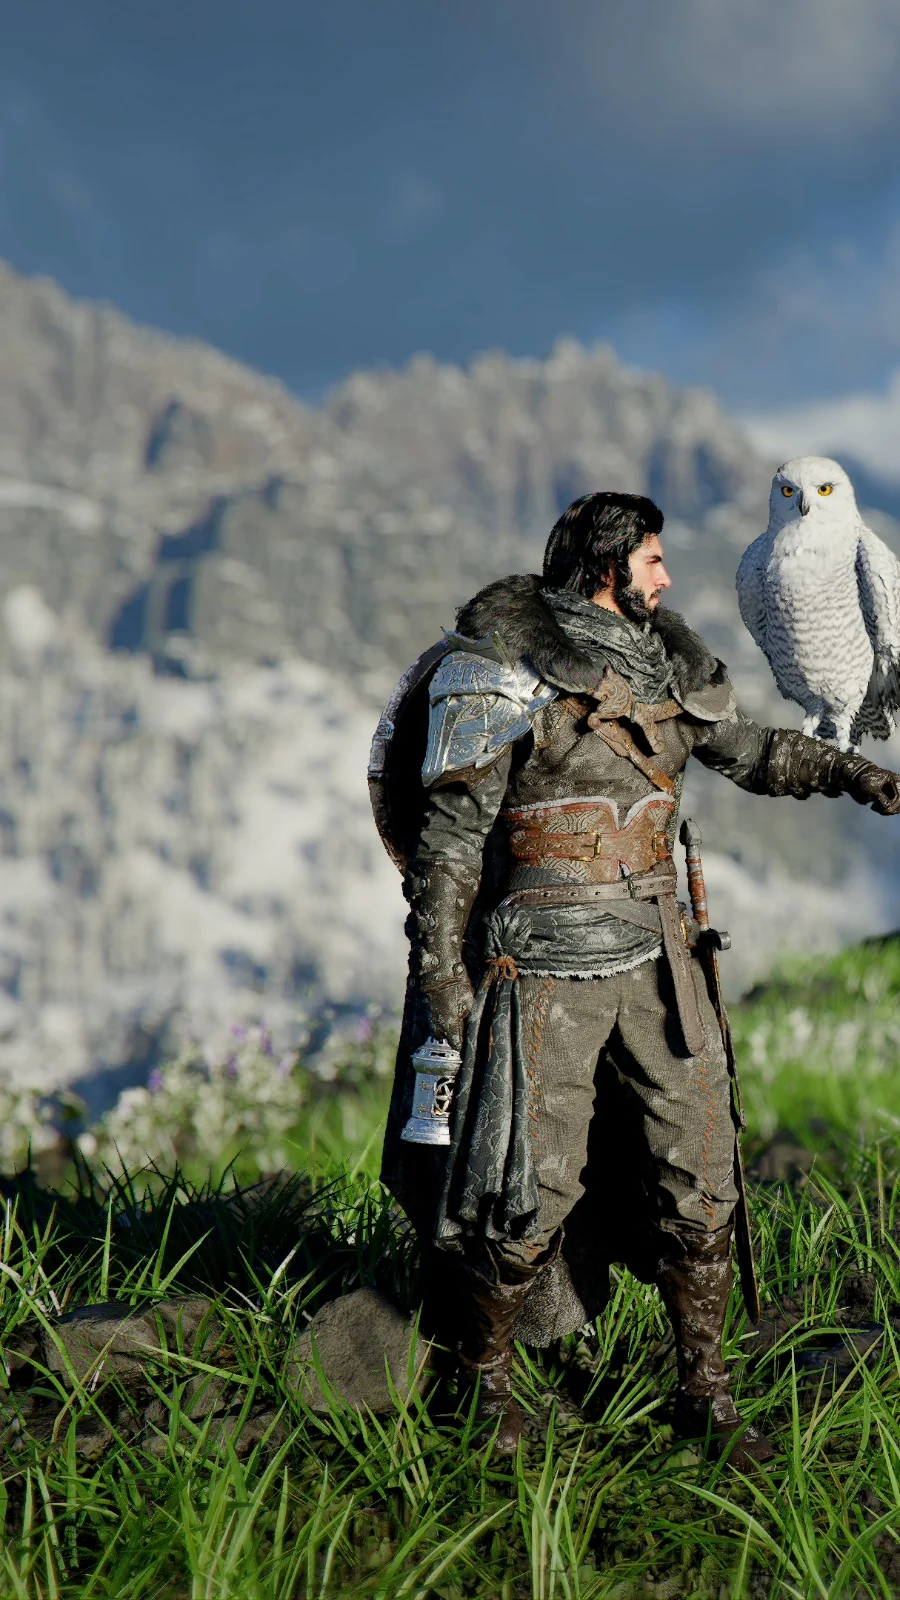
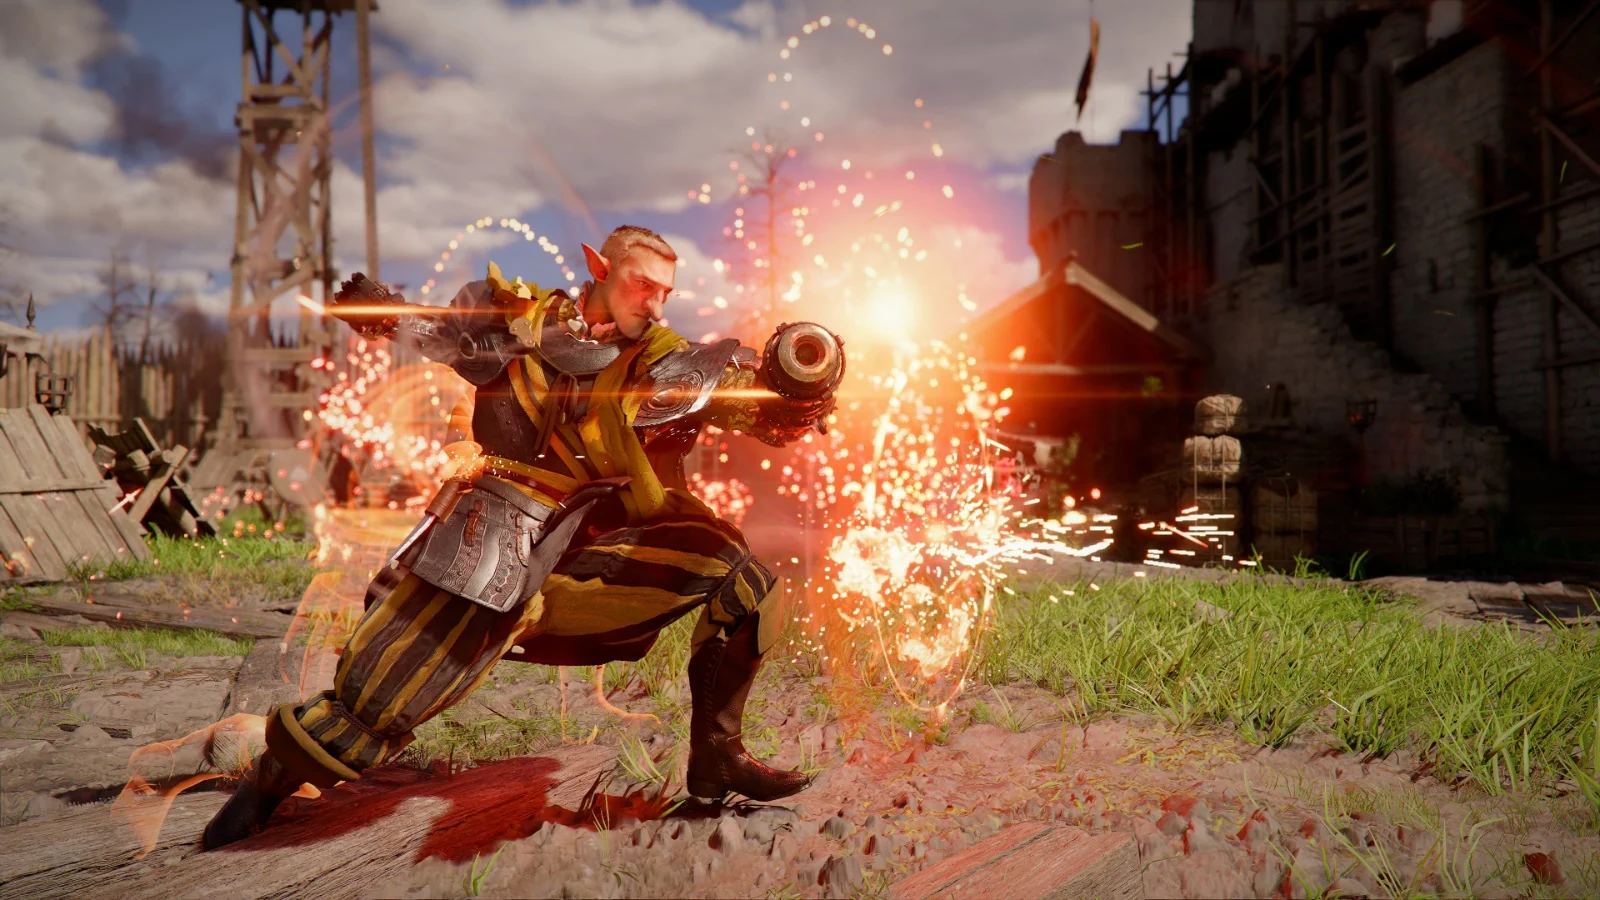
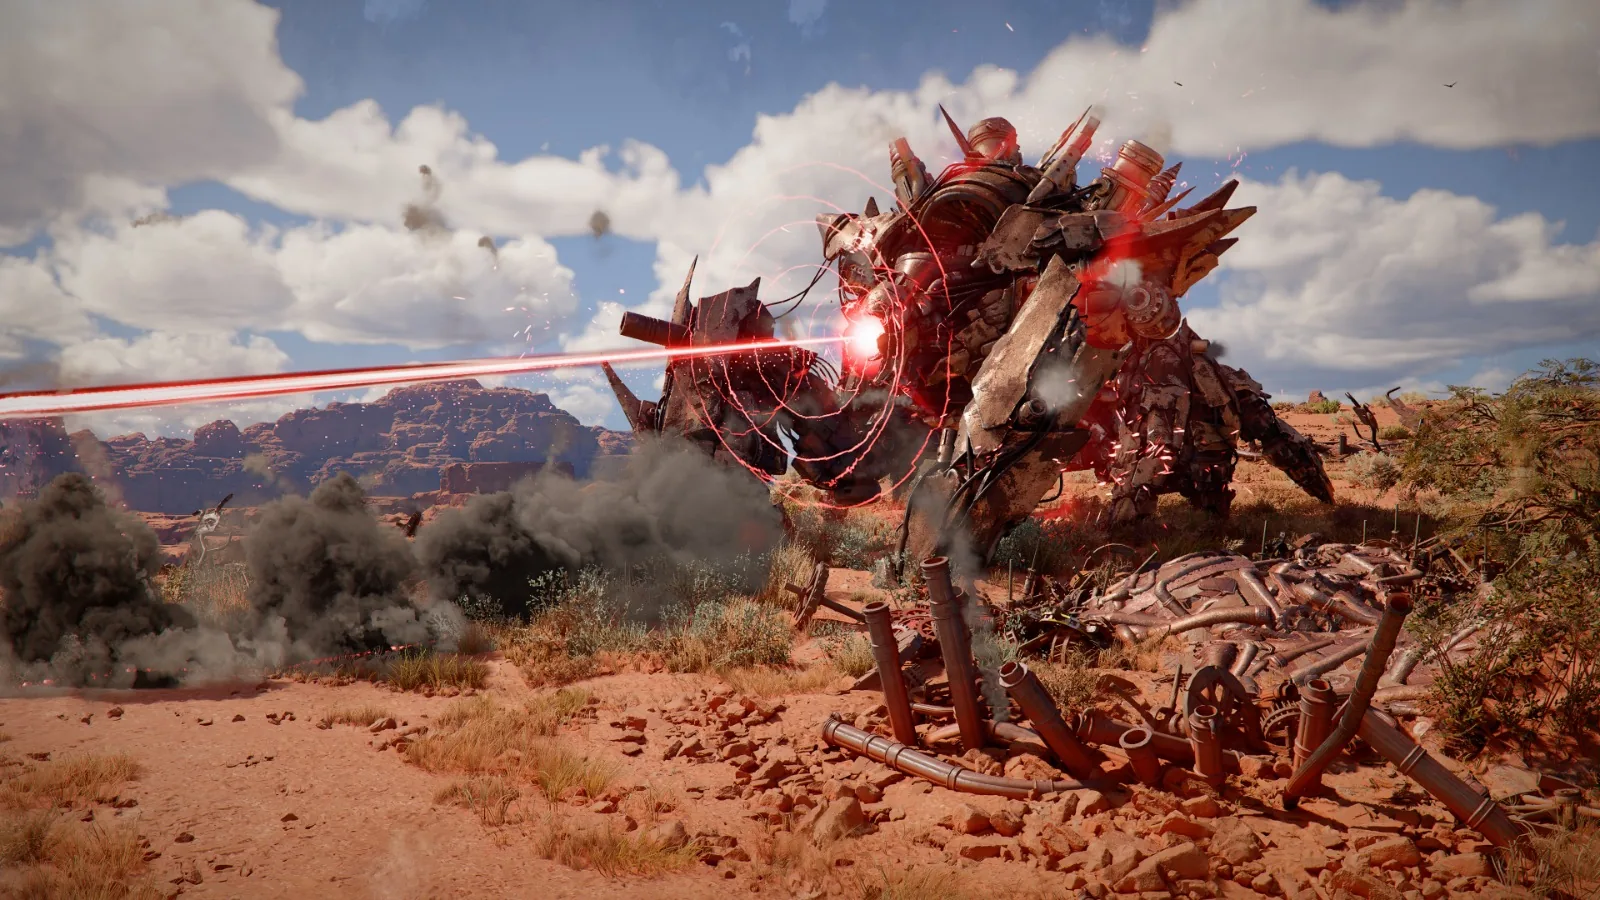
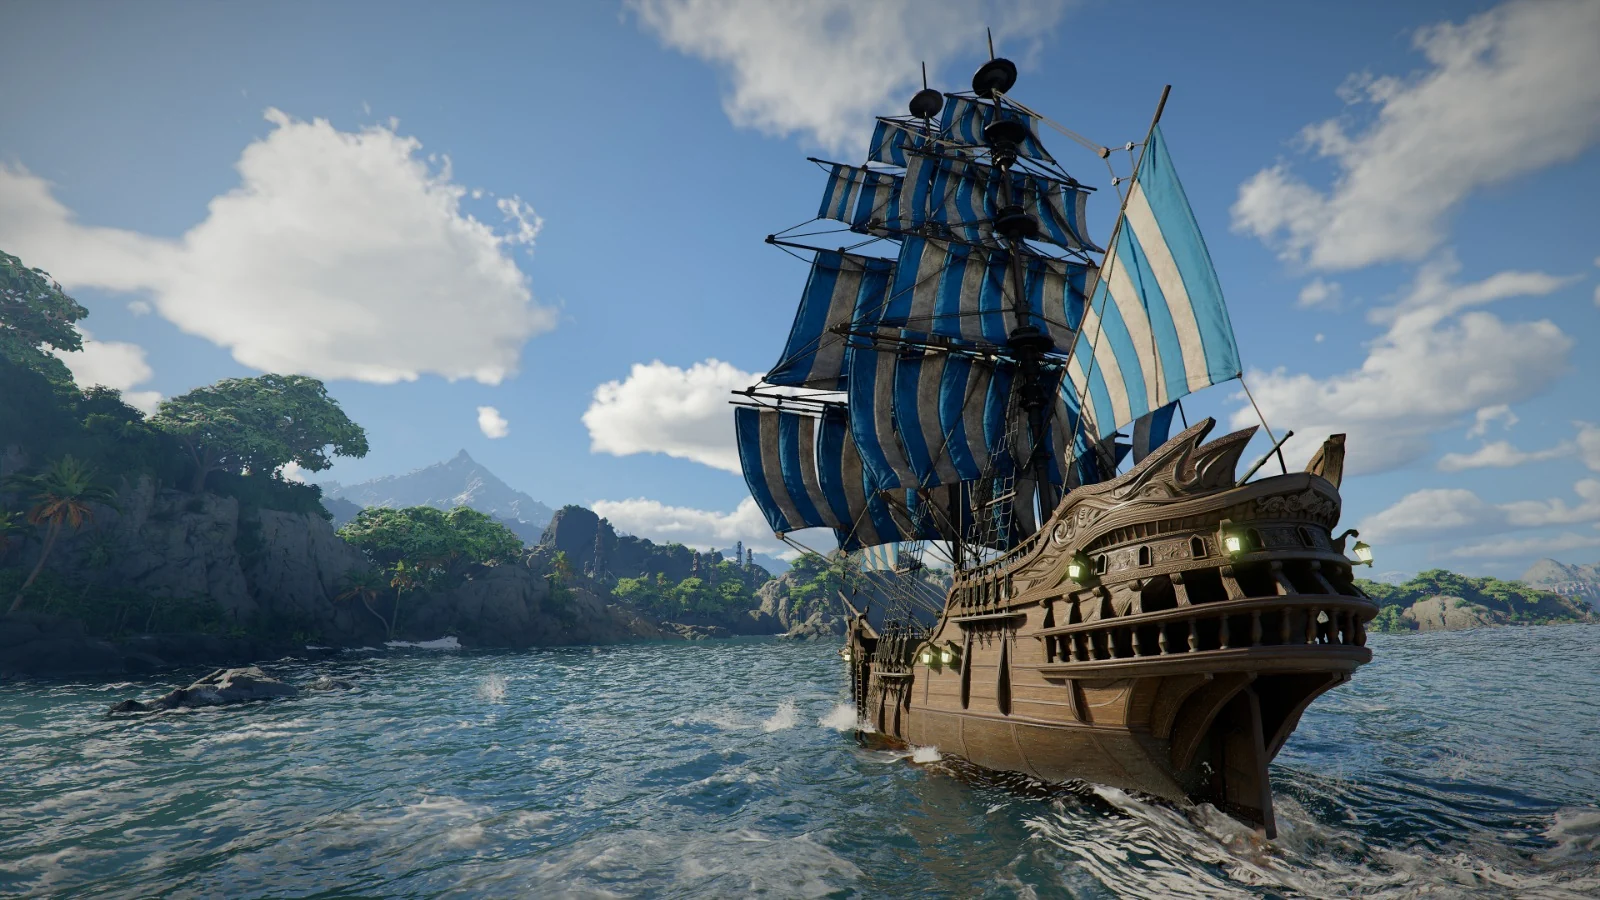
Browse the data
The weekly chart
Week 45, 2026- 01Counter-Strike 21,402,441
- 02Dota 21,096,364
- 03Phantom Blade Zero823,104
- 04PUBG: Battlegrounds806,873
- 05Apex Legends238,375
Cost-of-playing index
What a season or collection really costs
In preparation
Pity calculator
How many pulls for a 90% chance?
Apex Legends: 7.4% per pull, guaranteed by pull 30. Put in any rate and see the real odds, with the maths shown.
Open the calculator- Average pulls
- 12
- For a 90% chance
- 30
Why trust the numbers
“Every figure has a source and a date. If a publisher doesn’t disclose it, we say so.”
Read the methodology- Disclosed rates
- 75
- UK prices
- 404
- Source pages
- 426
How we check a number
- 01
From the publisher
Rates come only from the publisher’s own pages. Never fan wikis or data-mining.
- 02
Recorded as published
Each figure is stored exactly as listed, with the date we checked it.
- 03
Maths shown
Averages and chances are worked out from the rate, and re-checked every quarter.
Guides
The maths, explained
Plain-English explainers built on real disclosed rates and real UK prices.
All guidesHelp
Answers before you pull
The short version of our methodology.
Where do the drop rates come from?
Only from the publisher itself: its website, support pages or official odds page. We never use fan wikis or data-mining, and every rate links to the page we read it on, with the date.
What does “pity” mean?
A guarantee: the item is certain by a set pull, for example pull 30. We only record one when the publisher states it, and our averages use it.
Why isn’t a big game on the chart?
The chart only includes games rated PEGI 12 or higher (or an equivalent 12+ rating, such as ESRB Teen), so games rated PEGI 3 or 7 are left out of it. Steam figures also leave out console players.
How often is the data checked?
Game pages and the drop-rate index are re-checked at least once a quarter, and whenever a publisher changes its rates. The chart is updated weekly.
For game developers
Made a game? Add it to GamesChart
Studios, publishers and indie developers can add their games and a studio profile. Free, and reviewed by our team.
Using our numbers?
Free to cite with a link. Spotted something out of date? Tell us and we’ll re-check it.